
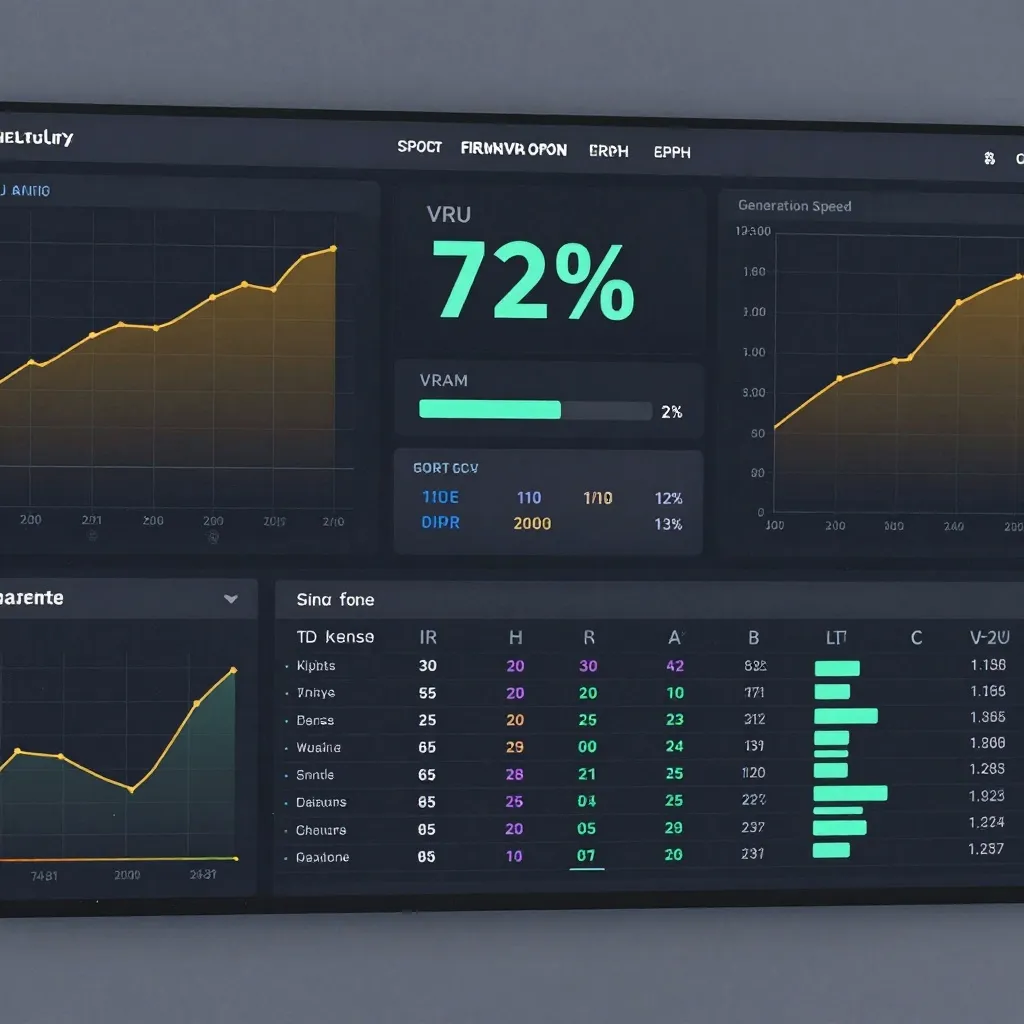
Z-Image Performance Dashboard: Monitor Your AI Workflows in Real-Time
You're generating images with Z-Image or ComfyUI, watching the progress bar inch forward. But is your workflow actually performing well? Are you getting the best possible speed from your hardware? More importantly—how would you even know?
Most AI image generation setups fly blind. They queue prompts, wait for outputs, and hope for the best. But professional workflows don't guess—they measure. A performance dashboard transforms guesswork into data, giving you real-time visibility into GPU utilization, memory usage, generation speed, and workflow efficiency.
This guide shows you how to build a comprehensive monitoring system for your Z-Image and ComfyUI workflows, revealing bottlenecks, optimizing resource allocation, and ultimately generating more images in less time.
Why Performance Monitoring Matters for AI Workflows
Before diving into tools and implementation, let's establish what you're actually tracking and why it matters. AI image generation is resource-intensive, and performance issues compound quickly:
The Hidden Cost of Inefficiency
Consider a typical ComfyUI workflow generating images at 9 seconds each. Sounds fast, right? But if VRAM usage is spiking to 95%, forcing constant memory offloading to system RAM (30-50× slower than GPU memory), you're leaving performance on the table. A properly monitored workflow might reduce that to 7 seconds simply by optimizing batch sizes or adjusting model precision.
Multiply that across hundreds of generations: 2 seconds saved per image × 500 images = 1,000 seconds (nearly 17 minutes) saved. That's 17 more images you could have generated in the same time.
What Professional Teams Monitor
Production-grade AI workflows track specific metrics that directly impact throughput and quality:
GPU Metrics:
- VRAM Usage: Target 75% maximum. Above 85% risks out-of-memory crashes; below 60% means you're underutilizing hardware
- GPU Utilization: Should consistently hit 90-100% during generation. If it's lower, your CPU or disk I/O is bottlenecking
- Temperature: GPUs throttle performance when overheating. Monitor to prevent thermal throttling
- Power Draw: Helps identify if you're hitting TDP limits, especially on laptops
Generation Metrics:
- Images per Minute: Your core throughput metric
- Time to First Token (TTFT): How long before the model starts generating
- Queue Depth: How many pending generations are waiting
- Success/Failure Rate: Track crashes and out-of-memory errors
Workflow Metrics:
- Model Loading Time: How long to switch between different models
- Prompt Processing Time: Text encoder performance
- VAE Decode Time: Often the slowest step in the pipeline
The Monitoring Landscape: Tools That Work
Several ecosystem tools provide monitoring capabilities for ComfyUI and Stable Diffusion workflows. Here's what works best for different use cases:
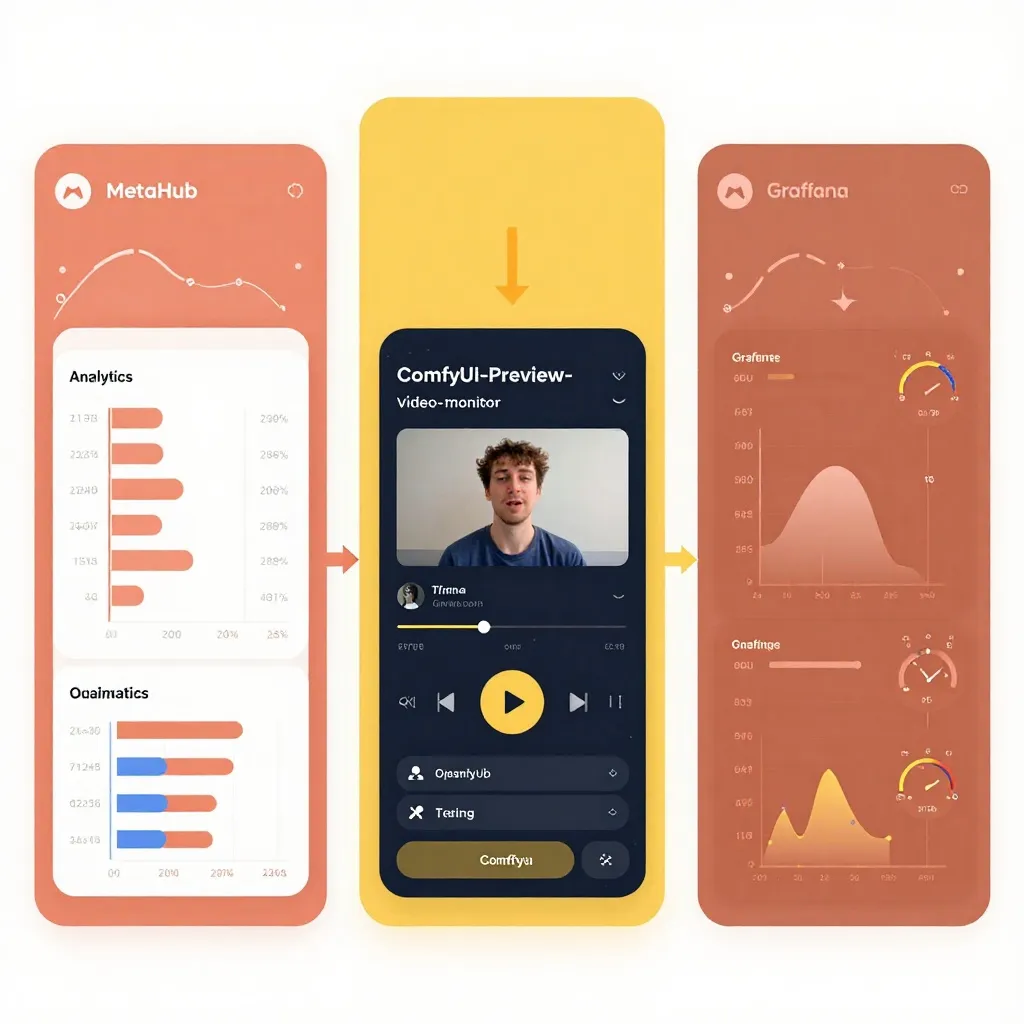
Image MetaHub (Pro Feature)
Image MetaHub offers the most comprehensive analytics dashboard for ComfyUI and Automatic1111 users. Its Pro tier includes:
Real-Time Monitoring:
- Live progress tracking during generation
- Unified queue management across multiple UIs
- Performance metrics with verified telemetry badges
Analytics Dashboard:
- Generation speed trends over time
- Model/LoRA performance comparison
- Prompt effectiveness analysis
- Workflow efficiency scoring
Metadata Parsing:
- Extracts full parameters from ComfyUI workflows
- Supports WebP, PNG, JPEG formats
- Automatic tagging and smart library features
Best For: Professional users running mixed ComfyUI/A1111 workflows who want comprehensive analytics without cloud dependencies.
ComfyUI-Preview-Video-Monitor
For users focused on video generation workflows or real-time experimentation, ComfyUI-Preview-Video-Monitor provides:
Live Preview System:
- Real-time generation preview with zoom/pan controls
- Instant fit modes and keyboard shortcuts
- Visual feedback with color-coded active states
Generation Vault Cache:
- Cross-session preservation of all generations
- Unlimited version history
- Snapshot functionality with embedded workflow data
Performance Features:
- Performance engine optimization
- Resource monitoring integration
- Progress tracking for long-running workflows
Best For: Video creators and experimenters who need instant visual feedback during workflow development.
Crystools
A lightweight ComfyUI extension that adds resource monitoring directly into the UI:
- Real-time GPU/CPU usage displays
- Progress tracking with ETA calculations
- Metadata viewing and comparison tools
- Image and JSON comparison features
Best For: Users who want basic monitoring without leaving ComfyUI's interface.
Enterprise Monitoring Stack
For production deployments, teams combine standard DevOps tools:
Prometheus + Grafana:
- Collect detailed GPU metrics via NVIDIA DCGM Exporter
- Create custom dashboards for specific workflows
- Set up alerts for resource exhaustion or performance degradation
vLLM Metrics:
- Track tokens per second throughput
- Monitor Time to First Token (TTFT) latency
- Analyze request queuing and batching efficiency
Best For: Teams running ComfyUI as an API service with multiple concurrent users.
Building Your Custom Dashboard
If off-the-shelf tools don't meet your needs, building a custom monitoring system gives you complete control. Here's how to architect one for Z-Image workflows:
Architecture Overview
A modern monitoring stack consists of four layers:
- Data Collection Layer: ComfyUI APIs and system monitoring agents
- Storage Layer: Time-series database (Prometheus, InfluxDB)
- Visualization Layer: Grafana or custom web dashboard
- Alerting Layer: Notifications via Slack, Discord, or email
Step 1: Enable ComfyUI Metrics Collection
ComfyUI exposes real-time data through its API. Enable monitoring by starting ComfyUI with these flags:
python main.py --enable-cors-header * --preview-method auto
Then collect metrics using a simple Python script:
import requests
import time
from datetime import datetime

COMFYUI_API = "http://127.0.0.1:8188"

def get_queue_info():
    """Get current queue status and running job info"""
    response = requests.get(f"{COMFYUI_API}/queue")
    return response.json()

def get_history():
    """Get generation history with timing data"""
    response = requests.get(f"{COMFYUI_API}/history")
    return response.json()

def track_performance():
    """Continuously track and log performance"""
    while True:
        queue_data = get_queue_info()
        running = queue_data.get("queue_running", [])

        if running:
            job = running[0]
            print(f"[{datetime.now()}] Job ID: {job[1]}")
            # Extract timing info, model data, etc.

        time.sleep(1)
Step 2: Monitor GPU Metrics
Use pynvml (NVIDIA management library) or pynvml for AMD GPUs:
import pynvml

def get_gpu_stats():
    """Retrieve detailed GPU statistics"""
    pynvml.nvmlInit()
    handle = pynvml.nvmlDeviceGetHandleByIndex(0)

    # Memory usage
    mem_info = pynvml.nvmlDeviceGetMemoryInfo(handle)
    vram_used = mem_info.used / 1024**3  # Convert to GB
    vram_total = mem_info.total / 1024**3
    vram_percent = (mem_info.used / mem_info.total) * 100

    # GPU utilization
    util = pynvml.nvmlDeviceGetUtilizationRates(handle)
    gpu_util = util.gpu

    # Temperature and power
    temp = pynvml.nvmlDeviceGetTemperature(handle, pynvml.NVML_TEMPERATURE_GPU)
    power = pynvml.nvmlDeviceGetPowerUsage(handle) / 1000  # Convert to watts

    return {
        "vram_used_gb": vram_used,
        "vram_total_gb": vram_total,
        "vram_percent": vram_percent,
        "gpu_utilization": gpu_util,
        "temperature_c": temp,
        "power_draw_w": power
    }
Step 3: Build a Web Dashboard
Use Streamlit for rapid dashboard development:
import streamlit as st
import pandas as pd
import plotly.graph_objects as go

st.title("Z-Image Performance Dashboard")

# Create columns for key metrics
col1, col2, col3, col4 = st.columns(4)

with col1:
    st.metric("GPU Utilization", f"{gpu_stats['gpu_utilization']}%",
              delta="-2% from last hour")

with col2:
    st.metric("VRAM Usage", f"{gpu_stats['vram_used_gb']:.1f}GB",
              help=f"{gpu_stats['vram_percent']:.1f}% of {gpu_stats['vram_total_gb']:.0f}GB")

with col3:
    st.metric("Images/Hour", f"{throughput}",
              delta="+12% from yesterday")

with col4:
    st.metric("Avg Generation Time", f"{avg_time:.1f}s",
              delta="-0.8s from last week")

# Time series chart
fig = go.Figure()
fig.add_trace(go.Scatter(
    x=timestamps,
    y=vram_history,
    mode='lines',
    name='VRAM Usage',
    line=dict(color='#FF6B6B')
))

st.plotly_chart(fig, use_container_width=True)
Deploy this dashboard alongside your ComfyUI instance for at-a-glance performance visibility.
Essential Metrics to Track
Not all metrics are created equal. Focus on these high-impact measurements that directly inform optimization decisions:
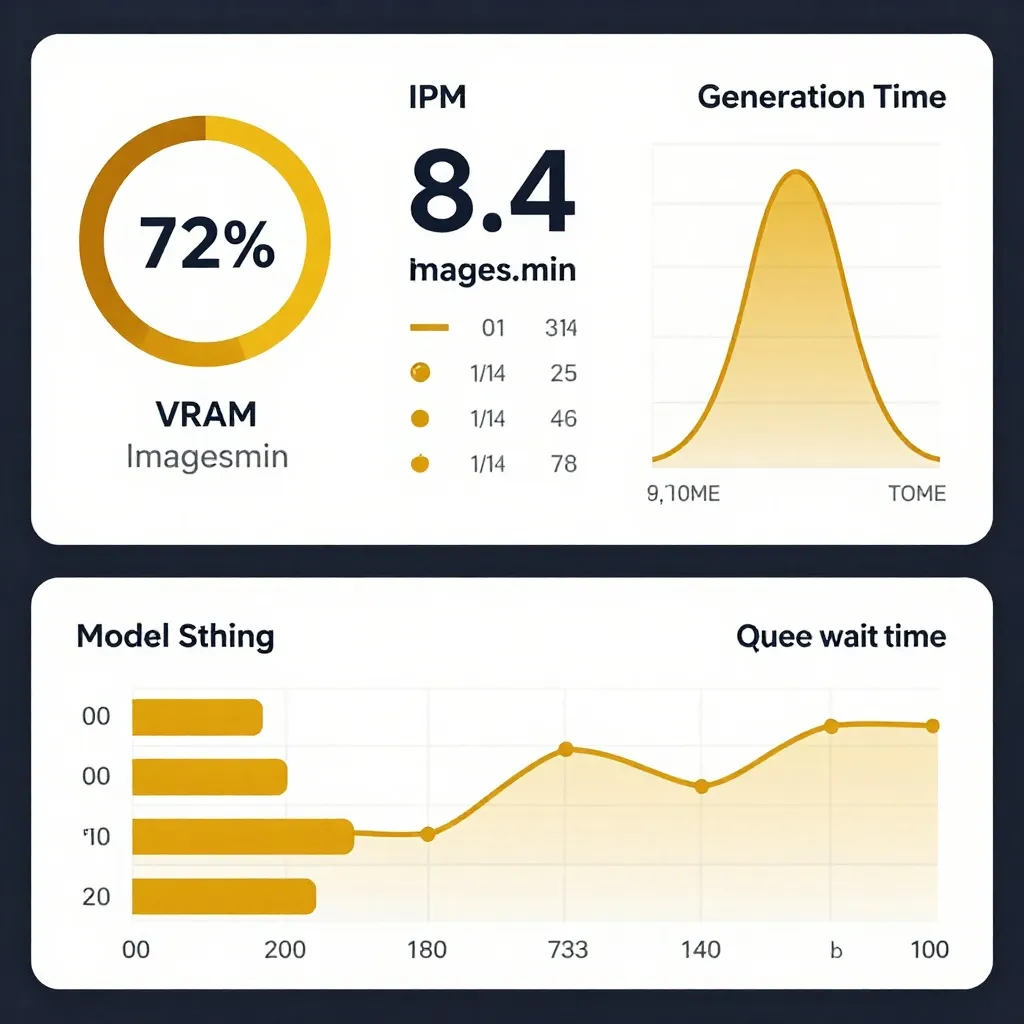
1. VRAM Utilization Percentage
What to Track: Current VRAM usage vs. total capacity
Why It Matters:
- Below 60%: You're underutilizing your GPU. Consider increasing batch size or resolution
- 60-85%: Sweet spot. Maximum throughput without crashes
- Above 85%: Danger zone. Risk of out-of-memory errors increases sharply
- Above 95%: Imminent crash territory. Reduce batch size or switch to quantized models
Actionable Insight: If you're consistently below 70%, increase batch size in your workflow. A 1024×1024 generation might use 8GB VRAM—batching 2 at a time could use 14GB and increase throughput by 80%.
2. Images Per Minute (IPM)
What to Track: Total successful generations divided by active generation time
Why It Matters: This is your ultimate productivity metric. Everything else—VRAM, GPU utilization, queue depth—is just a means to this end.
Benchmark Targets:
- SDXL/Z-Image on RTX 4090: 6-10 IPM
- SDXL/Z-Image on RTX 3090: 4-7 IPM
- Z-Image Turbo on RTX 4090: 12-20 IPM
- ComfyUI workflow optimization can improve IPM by 30-50%
Actionable Insight: Track IPM before and after workflow changes. A new LoRA or custom node might improve quality but halve your throughput. Decide if the quality tradeoff is worth it.
3. Generation Time Distribution
What to Track: Histogram of generation times for recent jobs
Why It Matters: Reveals inconsistencies in your workflow. A tight distribution (e.g., 8-10 seconds) indicates stable performance. A wide spread (5-25 seconds) suggests bottlenecks like model reloading or thermal throttling.
Visualization: Use a box plot or violin plot to see outliers:
Median: 9.2s
P95: 12.5s
P99: 18.1s
Max: 24.3s (outlier—investigate)
Actionable Insight: If you see a bimodal distribution (two peaks), you likely have two different workflow behaviors. For example, simple prompts complete in 6s, complex prompts with ControlNet take 15s. Consider separating these into different queue lanes.
4. Model Switching Frequency
What to Track: How often you load different checkpoints/LoRAs
Why It Matters: Model loading is expensive. Switching from Z-Image to Flux and back might cost 10-20 seconds each time. If you're constantly switching, you're wasting significant time.
Calculation:
Model Load Time = (Total Switches) × (Avg Load Time)
If you switch 20 times/hour and each switch takes 15s:
20 × 15s = 300s = 5 minutes lost per hour
Actionable Insight: Batch similar prompts together. Do all Z-Image generations, then all Flux generations. This simple workflow change can save 10-15% of total generation time.
5. Queue Wait Time
What to Track: Average time from queue submission to generation start
Why It Matters: Long queue wait times indicate either insufficient resources or poor prioritization.
Targets:
- Interactive work: <5 seconds (you're waiting at the computer)
- Batch work: <2 minutes (you can step away and come back)
- Overnight jobs: Doesn't matter (you're sleeping anyway)
Actionable Insight: If wait times exceed targets, consider:
- Adding a second ComfyUI instance (if you have multiple GPUs)
- Implementing priority queues (interactive jobs first)
- Reducing batch size to increase interactivity
Advanced Monitoring Techniques
Once you've mastered basic metrics, these advanced techniques provide deeper insights:
Real-Time Progress Tracking
ComfyUI's WebSocket API provides live progress updates during generation:
import websocket
import json

def on_message(ws, message):
    data = json.loads(message)
    if data['type'] == 'executing':
        node_id = data['data']['node']
        # Update dashboard with current node being executed
    elif data['type'] == 'progress':
        value = data['data']['value']
        max_value = data['data']['max']
        progress = (value / max_value) * 100
        # Update progress bar

ws = websocket.WebSocketApp("ws://localhost:8188/ws",
                            on_message=on_message)
ws.run_forever()
This lets you track which nodes in your workflow are taking the most time, revealing optimization opportunities.
Historical Trend Analysis
Store metrics over time to identify degradation patterns:
Daily Metrics:
- Total generations
- Average generation time
- Success rate (failed jobs / total jobs)
- Peak VRAM usage
Weekly Trends:
- Are generations getting slower over time? (Possible memory leak)
- Has your success rate dropped? (Driver update or model change)
- Are you utilizing GPU capacity? (Opportunity to increase batch size)
Export these metrics to CSV for analysis in Excel, Google Sheets, or Python:
import pandas as pd

# Load historical data
df = pd.read_csv('performance_history.csv')

# Calculate 7-day rolling average
df['gen_time_7day'] = df['generation_time'].rolling(7).mean()

# Plot trend
df.plot(x='date', y=['generation_time', 'gen_time_7day'])
Multi-GPU Workload Balancing
If you have multiple GPUs, monitor each independently to ensure balanced utilization:
for gpu_id in range(pynvml.nvmlDeviceGetCount()):
    handle = pynvml.nvmlDeviceGetHandleByIndex(gpu_id)
    util = pynvml.nvmlDeviceGetUtilizationRates(handle)
    print(f"GPU {gpu_id}: {util.gpu}% utilized")
Imbalance Example:
- GPU 0: 95% utilization
- GPU 1: 45% utilization
Solution: Configure your workflow manager (like ComfyUI's multi-GPU setup) to distribute jobs more evenly, or assign different model types to each GPU (Z-Image on GPU 0, video models on GPU 1).
Predictive Alerting
Set up alerts before problems impact users:
Memory Alerts:
IF VRAM > 85% for 5 minutes THEN notify "Approaching OOM threshold"
Performance Alerts:
IF avg_generation_time > 15s for 10 generations THEN notify "Performance degradation detected"
Failure Alerts:
IF failure_rate > 5% in last hour THEN notify "Elevated error rate—check logs"
Send alerts via Slack webhook, Discord bot, or email to stay informed without constantly watching the dashboard.
Optimizing Workflows Based on Data
Monitoring is useless without action. Here's how to use dashboard data to systematically improve performance:
Phase 1: Baseline Measurement
Run your standard workflow for 100 generations and record:
- Average generation time
- VRAM usage distribution
- Success rate
- Most common failure modes
This establishes your performance baseline.
Phase 2: Single-Variable Experiments
Change one thing at a time and measure impact:
Experiment A: Batch Size
- Baseline: 1 image per batch, 9.2s avg
- Test: 2 images per batch, 14.5s avg (7.25s per image = 21% faster)
Experiment B: Model Precision
- Baseline: FP16 Z-Image, 9.2s avg
- Test: FP8 Z-Image, 7.1s avg (23% faster, minimal quality loss)
Experiment C: Text Encoder
- Baseline: Full T5 XXL, 9.2s avg
- Test: Distilled T5, 8.1s avg (12% faster, similar quality)
Experiment D: Scheduler
- Baseline: Euler A, 20 steps, 9.2s avg
- Test: DPM++ 2M Karras, 15 steps, 7.8s avg (15% faster)
Keep winning changes, discard losers.
Phase 3: Workflow Segmentation
Not all generations need maximum speed. Segment your workflow:
Fast Lane (50% of jobs):
- Z-Image Turbo
- 1024×1024 resolution
- 4-6 steps
- Target: <5 seconds
Quality Lane (30% of jobs):
- Z-Image base model
- 1024×1024 resolution
- 20-30 steps
- Target: 10-15 seconds
Experimental Lane (20% of jobs):
- New models, custom workflows
- Variable resolution
- Variable steps
- Target: Complete successfully, time doesn't matter
Route jobs to appropriate lanes based on priority and requirements.
Phase 4: Continuous Monitoring
Set up automated reports that email you weekly summaries:
Weekly Performance Report - Week of Jan 15-21, 2026

Total Generations: 1,247
Success Rate: 98.7% (16 failed)
Average Generation Time: 8.3s
VRAM Usage: Median 72%, Peak 89%

Top Models Used:
- Z-Image Turbo: 623 (50%)
- Z-Image Base: 372 (30%)
- Flux: 252 (20%)

Errors Breakdown:
- Out of Memory: 12 (75% of errors)
- Timeout: 4 (25% of errors)

Recommendations:
- VRAM spike to 89% suggests batch size increase opportunity
- Consider adding 2nd instance for overflow during peak hours
Review these reports weekly and address emerging issues before they become crises.
Real-World Performance Wins
Let these case studies inspire your monitoring journey:
Case Study 1: The VRAM Ceiling
Problem: Artist generating 20 images per session, experiencing random crashes after 15-20 generations.
Monitoring Revealed: VRAM usage creeping from 75% to 95% over successive generations. Model cache not releasing between jobs.
Solution: Added explicit memory clearing between batches:
import torch
import gc

torch.cuda.empty_cache()
gc.collect()
Result: Crashes eliminated, sustained 75% VRAM usage, 20% increase in total throughput.
Case Study 2: The Model Switching Bottleneck
Problem: Design studio alternating between Z-Image and Flux, averaging 14 seconds per generation.
Monitoring Revealed: Model loading taking 8-10 seconds per switch. With 30 switches per hour, losing 4-5 minutes.
Solution: Implemented "workflow lanes"—dedicated ComfyUI instances for each model type, with shared queue manager routing jobs appropriately.
Result: Reduced model switches from 30/hour to 3/hour, saved 3.5 minutes of overhead, improved effective throughput by 25%.
Case Study 3: The Thermal Throttling Mystery
Problem: Laptop user seeing generation times double after 30 minutes of use.
Monitoring Revealed: GPU temperature climbing from 65°C to 87°C, triggering thermal throttling. Fan curves too conservative.
Solution: Custom fan curve using nbfc (NoteBook FanControl), maintained GPU at 75°C max.
Result: Consistent generation times, no thermal throttling, extended battery life (ironically).
Building Your Monitoring Strategy
Don't try to monitor everything at once. Follow this progressive approach:
Week 1: Core Metrics
- GPU utilization and VRAM usage
- Generation time (success only)
- Success/failure rate
Week 2: Workflow Metrics
- Model switching frequency
- Queue depth and wait time
- Images per minute
Week 3: Advanced Metrics
- Per-node timing (which workflow steps are slowest)
- Historical trend analysis
- Multi-GPU balance (if applicable)
Week 4: Alerting & Automation
- Configurable thresholds
- Automated reports
- Slack/Discord notifications
Your Action Plan
Transform from flying blind to data-driven in four steps:
-
Install a monitoring tool (30 minutes)
- Try Image MetaHub Pro for comprehensive analytics
- Use ComfyUI-Preview-Video-Monitor for live preview
- Build custom dashboard with Streamlit for complete control
-
Establish baseline (1 day)
- Run 100 standard generations
- Record key metrics
- Document your current performance
-
Run single-variable experiments (1 week)
- Test batch size changes
- Try different model precisions
- Experiment with schedulers and steps
- Keep what works, discard what doesn't
-
Implement continuous monitoring (ongoing)
- Set up weekly reports
- Configure alerts for critical issues
- Review metrics monthly and adjust strategy
Performance monitoring isn't about obsessing over numbers—it's about understanding your tools deeply enough to extract maximum value. Whether you're a solo creator generating a dozen images a day or a studio pumping out thousands, data-driven optimization pays dividends in time saved and quality gained.
Start monitoring today. Your future self (and your GPU) will thank you.
Further Reading:
- ComfyUI Performance Crisis: How to Fix the 2-Minute Lag - Troubleshoot performance bottlenecks
- 8GB VRAM GGUF Guide - Optimize for limited memory
- ComfyUI Workflow Guide - Master advanced workflows
- Z-Image Turbo - High-speed image generation
Note: This article was updated on January 22, 2026 to reflect the latest monitoring tools and best practices for AI image generation workflows. Metrics collection and visualization techniques continue to evolve—check tool repositories for recent updates.